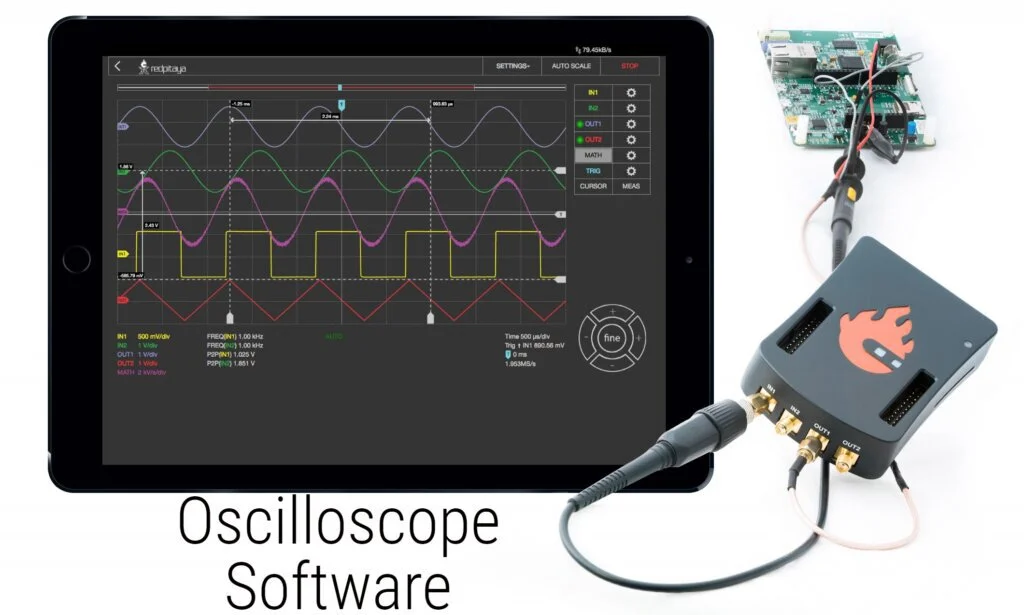
An oscilloscope is used by professional sound experts and electrical engineers to measure and identify the sound signals and study multiple waveform patterns on the interface. Users have to manually adjust the frequency so that they can be seen on the dashboard.
You can analyze the voltage plots on the graph and print out the visual representation of a time wave in a particular interval. Professional had to spend hours in order to adjust the wavelength and stabilize them across the provided parameters. So, Oscilloscope software has been invented to streamline the whole process.
What is Oscilloscope Software?
Oscilloscope software for the computer is used too often in professional audio studios and to convert analog audio into the waveform. They use a computer’s soundcard to perform operations like converting the audio into a voltage and then digital form.
The voltage is then translated over a graph in the software, which shows us oscillations of the sound per minute, second, or even millisecond. It does not require any additional device to do it, so it is also cheap. Most universities and colleges use Oscilloscopes for experimental purposes to teach students about the properties of sound.
The working process of such software is like that they can take audio input through multiple methods like directly from the PC’s microphone, by a music file, or by a recording. Then, it converts the data into voltages. You can adjust the sound output by varying the frequencies along a particular axis.
7 Best Oscilloscope Software
Keeping in view the demands and expertise of professional users, seven of the best oscilloscope software available in the market are presented in this article, along with features, pros, and cons. This way, users can opt for the most feasible one based on their needs.
1. Visual Analyzer
Visual Analyzer is frequency analyzing software that converts your PC into an audio amplifier. You do not need any additional device to amplify your audio. Simply install it on your desktop and start working on it. It takes input from the microphone of your PC and then converts it into voltage, which is then translated into waveform.
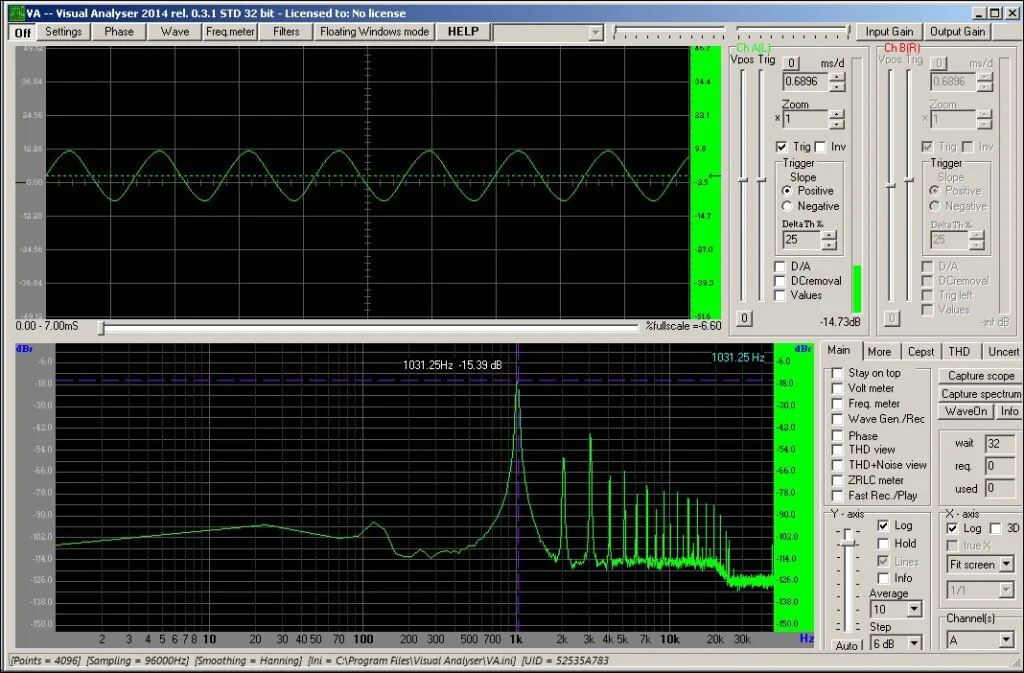
Visual Analyzer runs on Windows 9x ME, 2k, XP, NT, Server, Vista, 7, 8. The visual Analyzer 2014 version is now available for 64 and 32-bit platforms and is no longer compatible with Windows 9x. The software is freeware and can be downloaded from the given link.
Features
- Amplitude and Phase Display
- Wave from Generator
- Low Pass Filtering
Pros
- API Calls Support
- Cross-Correlation
- Frequency Meter
Cons
- Incorrect THD Measurements
- Complex Interface
- Not for New Users
2. Frequency Analyzer
Frequency Analyzer is simple software used to show you the audio waveform in a graph form. This application works by converting the inputted audio into a voltage and then converting it into the digital form, then showing the results in graphical form to the users.
The software is entirely free to use, and you do not have to pay any fee to avail its features. Any user can select from 8 to 16 bits per sample based on personal needs. It can also get the direct input from the microphone, or you can choose a WAV or BMP format file to show its graph in it.
Features
- Frequency Response
- Distortion Characteristics
- Occupied Bandwidth
Pros
- Basic Pre-Compliance Testing
- EMC Testing
- Magnitude Measurement
Cons
- No Live Support
- Limited Advance Features
3. Zelscope
Zelscope is analog audio to the digital audio converter, which shows the data in a graphical form that the user can understand. It converts your PC into a dual-trace storage oscilloscope and spectrum analyzer. It can read input from music, speech, mic, or from any electronic circuit and shows you the graphical output of the data.
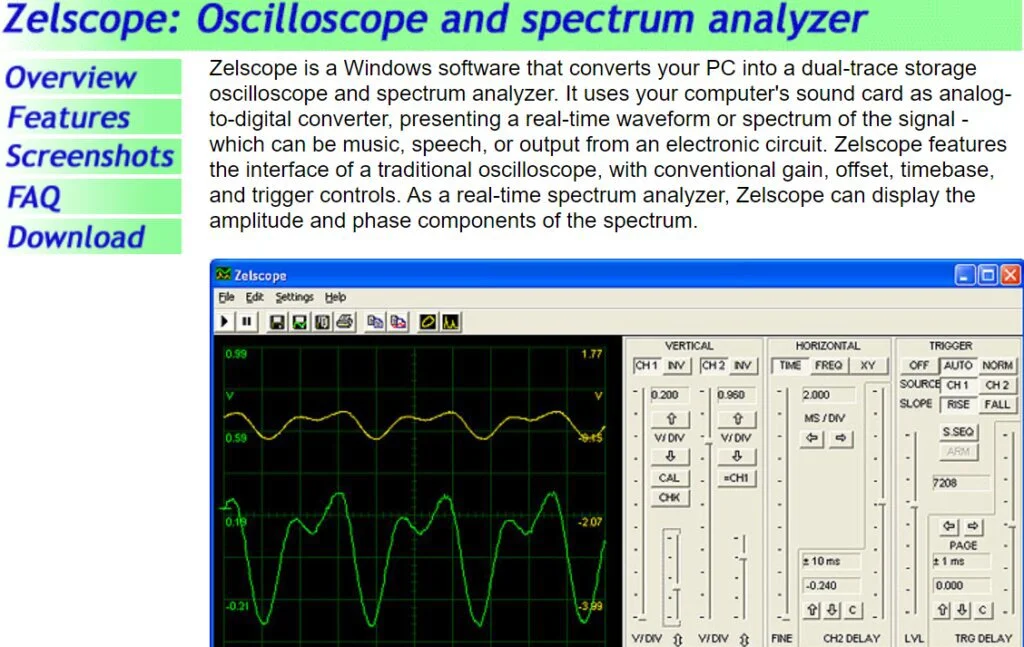
The digital sound is shown in a graphical form that shows oscillations per millisecond. Also, as a real-time spectrum analyzer, Zelscope can display the amplitude and phase components of the spectrum. It is freeware and available from the given link. You can measure the time phase in and out of any waveform.
Features
- Real-time Display
- Single and Dual Trace
- Phase Adjustment
Pros
- Spectrum Analyzer
- Sound Cards
Cons
- No Developer Support
- Lacks Audio Adjustment
4. Winscope
Winscope comes in the top list of many oscilloscope software and is very significant in its performance. It takes the input of audio which is amplified by the sound card of the user’s PC, and then converts it to an oscillatory graph form. Its bandwidth range is from 20 Hz to 20 kHz, audible by an average human.
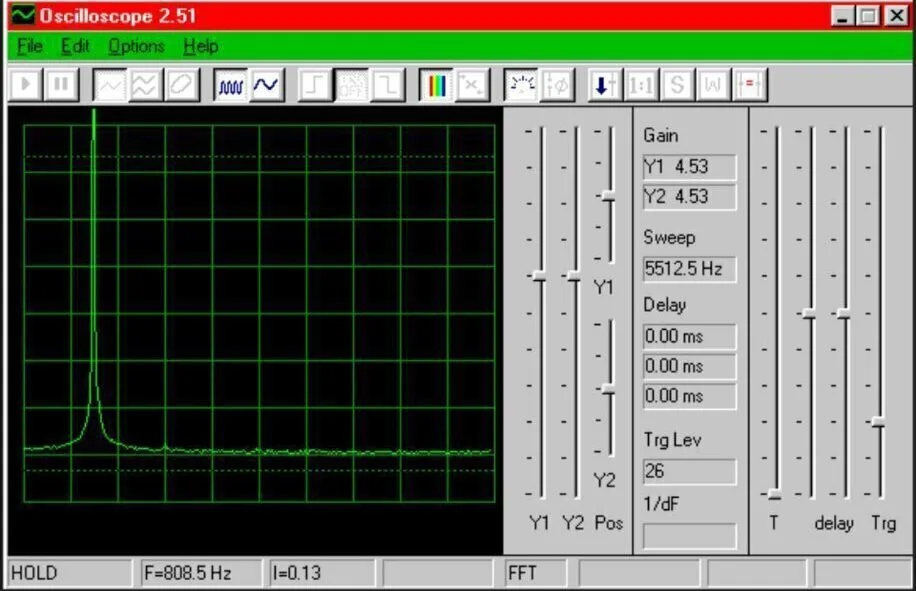
There are a few drawbacks to it, but the software runs very smoothly and gets your work done. It has many other features to help you, and the software is free to download and use. It can automatically identify the disturbing signal in the waveform and display its magnitude and time lag on the dashboard.
Features
- Parameters Alignment
- ComAP Monitoring
- Support Connections
Pros
- Regulator Setup
- Structured Interface
- Regular System Updates
Cons
- No Data Storage
- Limited Logs Creation
5. Soundcard Oscilloscope
Soundcard Oscilloscope software is developed with LabView that uses the PC sound card to provide data to a digital oscilloscope. The program contains a signal generator and a frequency analysis. Its main features are elementary to learn and use, so it is beneficial for both learners and professionals.
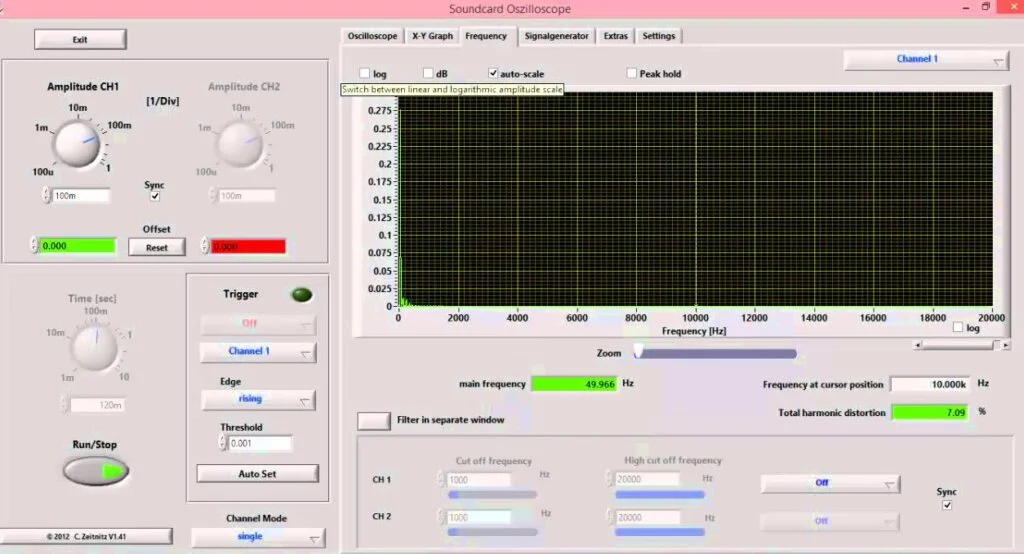
Some of the features are the x-y mode, Waterfall diagram, frequency spectrum as a function of time, frequency filter: low-, high-, band-pass and band-stop, Audio Recorder to save data to a wave file. The program is very suitable for projects in schools and universities.
Features
- Professional Scope
- Voltage Adjustment
- Trigger Options
Pros
- Free to Use
- Spectrum Analysis
- Serial Data Decode
Cons
- No XY Origin Mode
- Limited Data Storage
6. Oscilloscope
Oscilloscope software is simple analog audio to the digital audio converter, which shows you the graphical oscillation data of an audio waveform. It is instantly compatible with Linux, Windows, and Macintosh. The software has many features to alter the graphical waveform data as you see it in real-time.
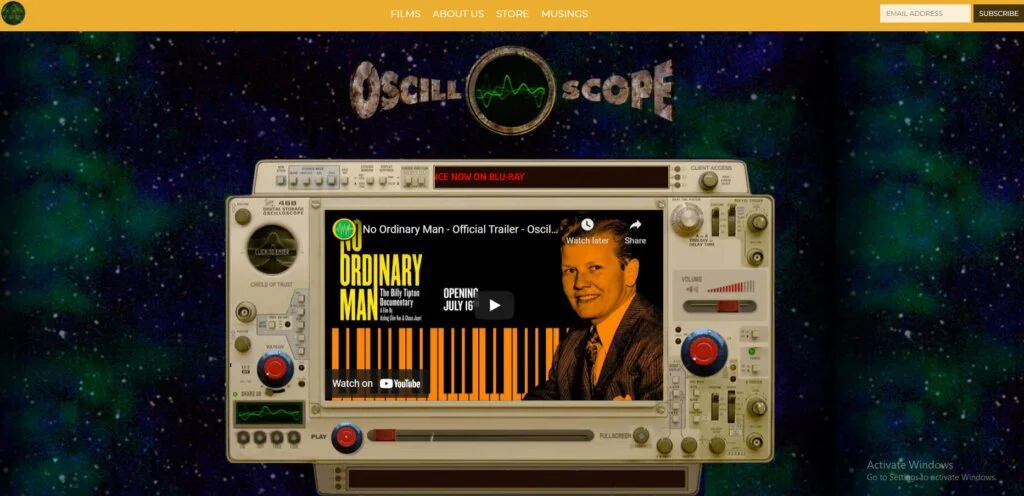
It is free, and as it supports most user platforms, you can install it on any device you have. It is updated in regular intervals, and the company keeps improving it constantly ta help the user better. It is mostly used by expert sound engineers to identify the alter pitches and frequencies.
Features
- Display Voltage Signals
- Variation over Time
- Audio Adjustments
Pros
- Vertical Axis Representation
- Structured Interface
- Easy to Use
Cons
- Limited Support Webniars
- No Live Support
7. Real-time Spectrum
Real-time Spectrum is high-end audio to digital waveform converter used in many big industries and professionals. It is army-level software used in many professional frequencies amplifying devices other than computers. You can view the time phase lags in it by adjusting the wavelength.
It can view the data in multiple views and graphs, and with its high resolution, the results and the data are viewable and unequivocal. It has a vast feature library and is optimistic about using it in professional projects. It offers multiple frequency options for better display and analysis.
Features
- Frequency Options
- Sound Magnitude
- Multiple Waveform Display
Pros
- Free to Use
- Developer Support
- Simple Tools and Dashboard
Cons
- No Platform Linkage
- Not for New Users
Conclusion
To sum up, this article has briefly discussed oscilloscope software along with its working methodology, advantages, and disadvantages. Users can download any of them based on their expertise and needs to analyze any waveform manually and automatically.
They have the built-in feature to identity the nonfunctional voltage waveform and display them by increasing their magnitude across a particular axis. Plus, users can learn the functionality of any tool in the software by using the learning center.

