Diagram and flowcharts make the complex workflow understandable. Flowcharts transform long work processes into simple to understand instructions; different types of diagrams allows users to get thoughts across rapid and effectively, for example, when users need to make an architecture design or system graph.
Making diagrams and graphs could be a complicated task, particularly when users do not have the correct tools to design them. By utilizing the right tools and resources makes the drawing job quick and productive activity, which implies using dedicated drawing software.
What is Diagram Software?
A diagram or drawing software refers to applications that allow users to create artwork from scratch. This software has the necessary tools to enable users to create diagrams ranging from flowchart drawing, architecture designs, network designs, and process diagrams.
These platforms are equipped with layouts for making all types of diagrams efficiently without any extensive preparation or work. With convenient user interfaces that make the program pleasant and straightforward to use.
Best Diagram Software for Windows, Mac and Linux
Below mentioned tools will help users make pleasant diagrams and flowchart drawing for business and learning activities across all platforms.
1. Draw.io
Draw.io is a helpful, free diagram designing tool with reliable integrated options through Google. It’s convenient in case users need to make simple drawings and charts, however, for better productivity and more layouts, the paid version is required.
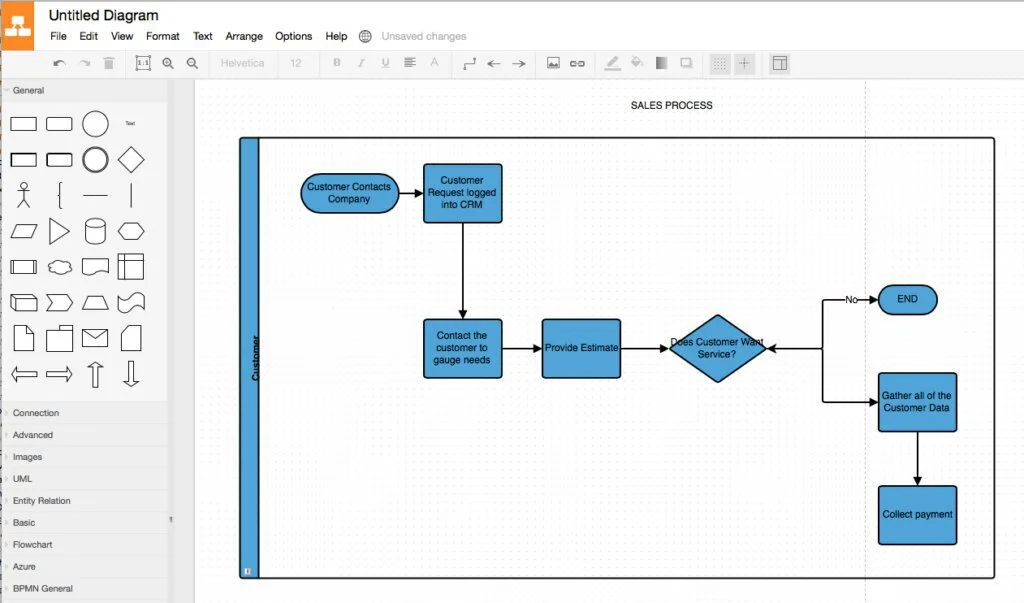
Draw.io enables a natural interface with drag and drop features, customizable diagram templates, and a broad layout library. Clients can make and alter a variety of graphs and diagrams, including flowcharts, ER diagrams, UML diagrams, and network diagrams. Its user-oriented features enable users to track and undo changes, download and upload different layouts and consequently share artworks.
Features
- Google Integration Support
- Real-time collaboration
Pros
- Seamless import/export of artworks
- Easy to use
Cons
- Not as easy for non-designers
Pricing
- Cloud: Starting from $5/10 users/month
- Server: Starting from $10/10 users/month
Visit: Draw.io
2. Pencil Project
Pencil Project is a free, open-source GUI prototyping tool used to create mockups of software and wireframe diagrams using its versatile tools. It is a desktop-based application available as a free download for Windows, Linux and Mac. It is used to draw software mockups, create flowchart drawings, and mobile app prototypes.
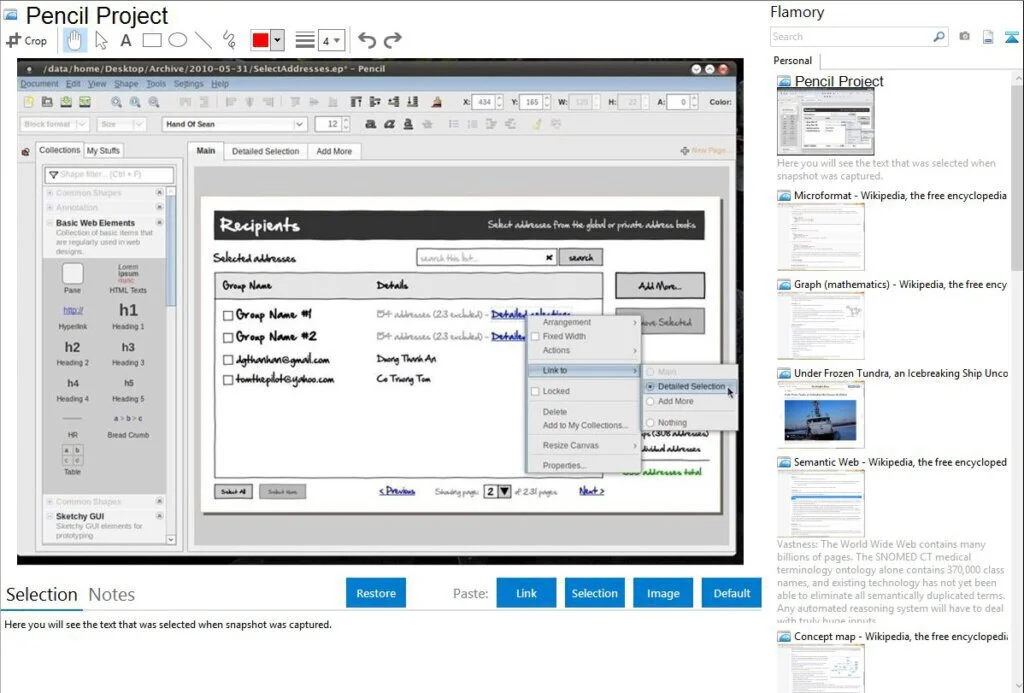
Pencil Project is packed with many intuitive features like data import and export, drag and drop editor, flowchart designer, and custom templates. Its tools collection has Basic Web Elements, Windows Widgets, Android ICS, iOS UI Stencils, and many more.
Features
- Built-in Shape Collections
- Inter-page linking
Pros
- Easy GUI Prototyping
- Import Cliparts from the Internet
Cons
- Not the most feature-rich application
Pricing
- Free
Download: Pencil Project for Windows | Mac | Linux
3. ConceptDraw Diagram
ConceptDraw Diagram is intended for proficient flowchart drawing, diagram designing, and illustrations. Its versatile, convenient tools help business and advanced designers to rapidly draw complex structures, frameworks, and procedures. ConceptDraw diagrams can be shared as an assortment of design files and CAD reports, printed pages, and web pages.
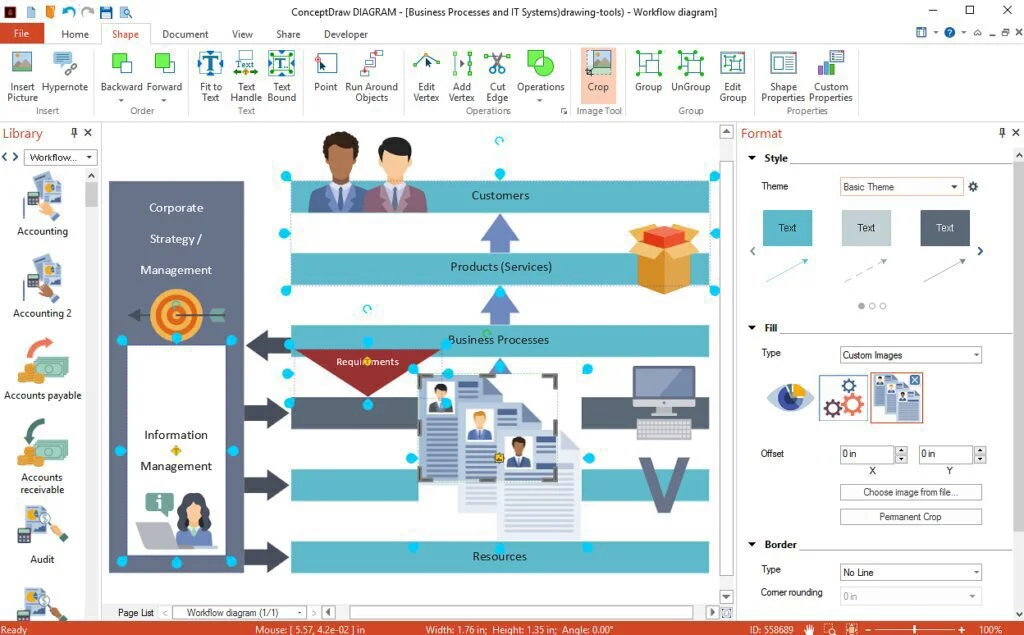
ConceptDraw’s propelled libraries of pre-drawn shapes are ideal for chart and diagram designing, including business, IT, project management, UML and system charts, architecture design, and network diagrams. The integrated scripting language enables users to assemble enterprise-level representation solutions. It is an on-premise drawing solution designed to caters to small and midsize businesses.
Features
- Rapid flowchart technology
- Building plan designer
Pros
- Live Objects Support
- MS Viso Compatibility
Cons
- Require more support documentation
Pricing
- License: $199/user
Download: ConceptDraw Diagram for Windows
4. Dia
Dia Diagram Editor is a free open source drawing solution available for Windows, Mac, and Linux. Dia bolsters over 30 distinctive design types like flowcharts, network diagrams, and database models. Over a thousand readymade objects enable users to draw proficient designs.
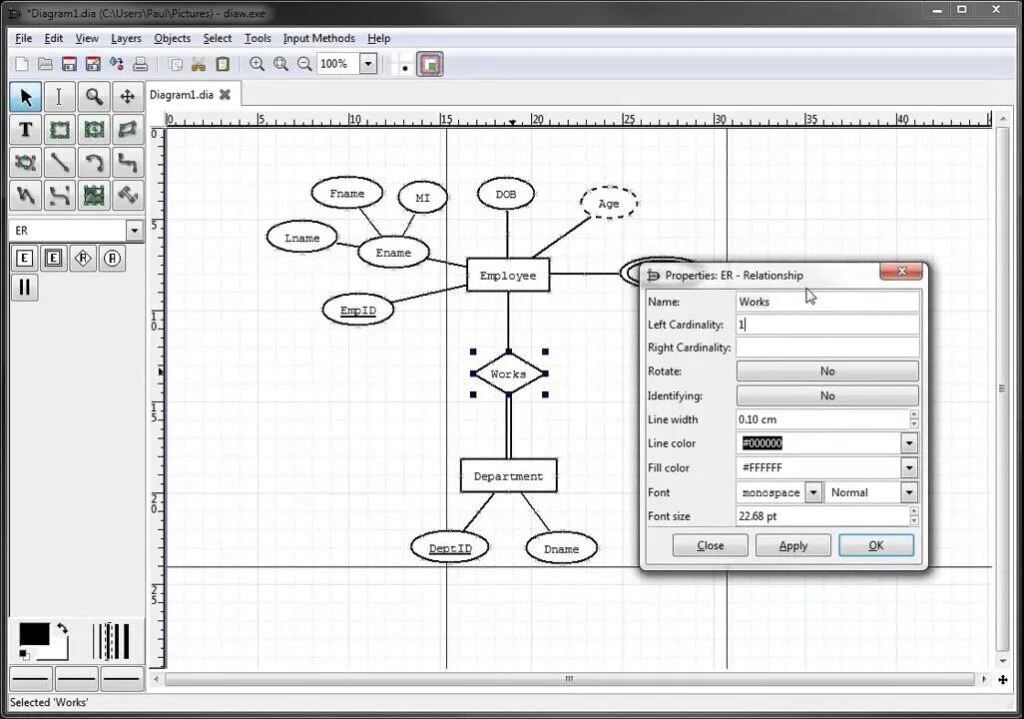
Dia can peruse and compose various raster and vector graphics designs. Program designers and database managers can utilize Dia to produce code skeletons from their drawings. Dia can be scripted and broadened due to its open-source nature by using Python language.
Features
- More than 1000 predefined objects and symbols
- Ability to print large diagrams spanning multiple pages
Pros
- Scriptable via Python
- Super light and easy to install
Cons
- The graphical interface is old and outdated
Pricing
- Free
Download: Dia for Windows | Mac | Linux
5. Process Simulator
Process simulator enables users to discover solutions efficiently. With the simulation add-on Procedural Test System, allows users to imagine, break down and streamline operations conveniently in the natural Microsoft Visio interface. Change processes, and business forms into dynamic, graphically engaging simulated models.
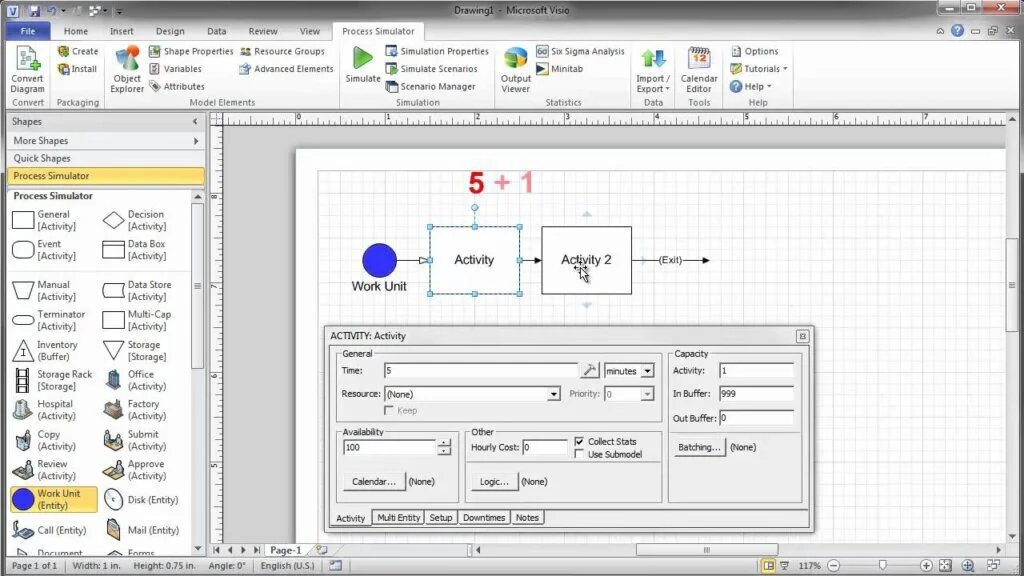
Process Simulator is a free add-on that can change static flowcharts and work process diagrams into dynamic simulation models it integrates as a module to MS Visio, enabling users to make and run simulation models within Visio consistently. It is a straightforward, prescient, efficiency, and productivity improvement design tool.
Features
- Dynamic Simulation Models
- Process automation
Pros
- MS Viso Integration
- No coding required
Cons
- Occasional bugs
Pricing
- Free
Download: Process Simulator for Windows
6. Adioma
Adioma is an infographic producer that creates automated diagrams for users by utilizing visual language and infographic formats. In Adioma, all infographic formats are created algorithmically. Regardless of the number of features included, the user’s layouts consistently fabricate itself efficiently and look pleasing.
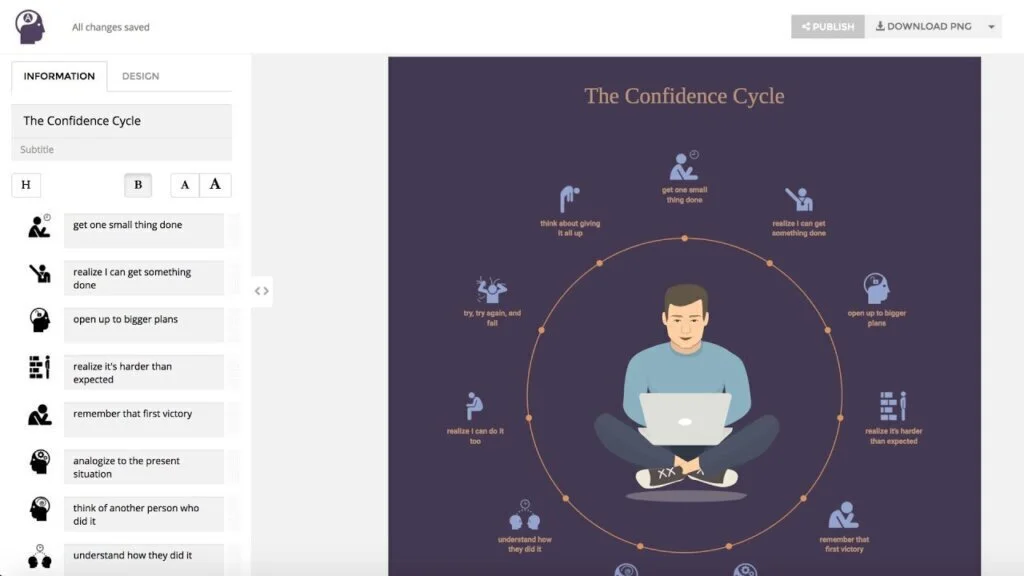
Adioma enables users to effectively coordinate their words and portray them as pictures with unique symbols and illustrations without the need of any drag and drop activity. Utilizing a symbol language, which is an enormous icon library consisting of all icons constructed in a similar graphic style.
Features
- Vast icons library
- Ready to use templates
Pros
- Minimal effort required
- Words to pictures
Cons
- Requires a high-end system to use
Pricing
- Pro: $39/month/billed annually
- Expert: $69/month/billed annually
- Business: $300/month/billed annually
Visit: Adioma
7. QuickDBD
QuickDBD is an online application to create database diagrams rapidly. In contrast to traditional database designs, QuickDBD enables users to make a database diagram by simply by writing its schema. This tool is especially helpful for clients who work mostly on keyboards, rather than graphical UIs.
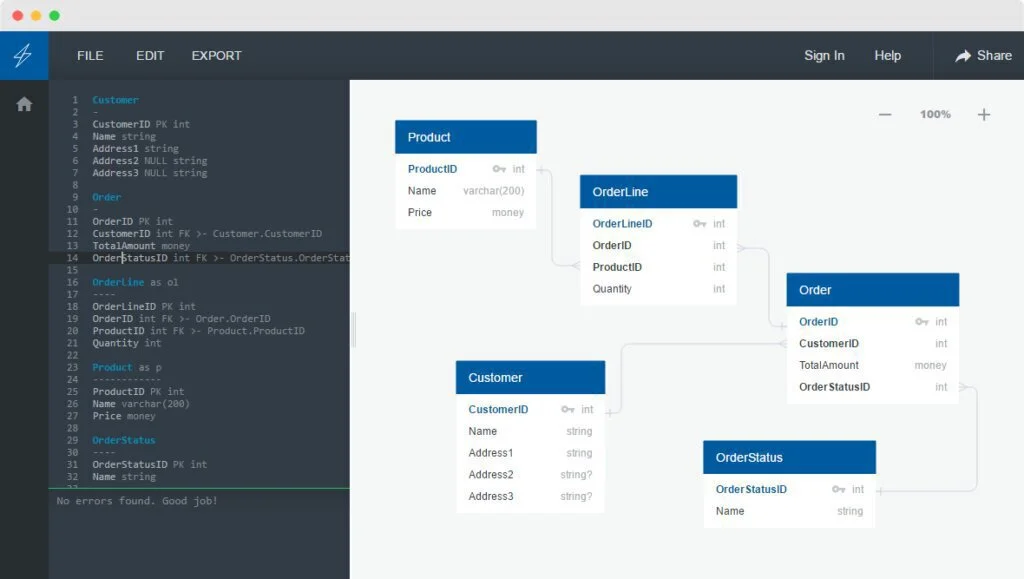
It also has a free version with basic functionalities. QuickDBD is based on a SaaS platform and provides services over the web. Users can make professional-level database diagrams, share their work online and collaborate on projects, save time and work fluently using QuickDBD.
Features
- Schema to Diagrams
- Online Collaborations
Pros
- Minimal effort required
- Simple user interface
Cons
- Only limited to database designing
Pricing
- Subscription: $14/month
Visit: QuickDBD
8. Inkscape
Inkscape is a free and open-source vector graphics platform. This tool can be utilized to generate or alter vector graphics, for example, graphs, line art, flowcharts, diagrams, logos, symbols, and intricate artworks. Inkscape’s default vector illustrations format is SVG. Although numerous different formats can be imported and are supported by it.
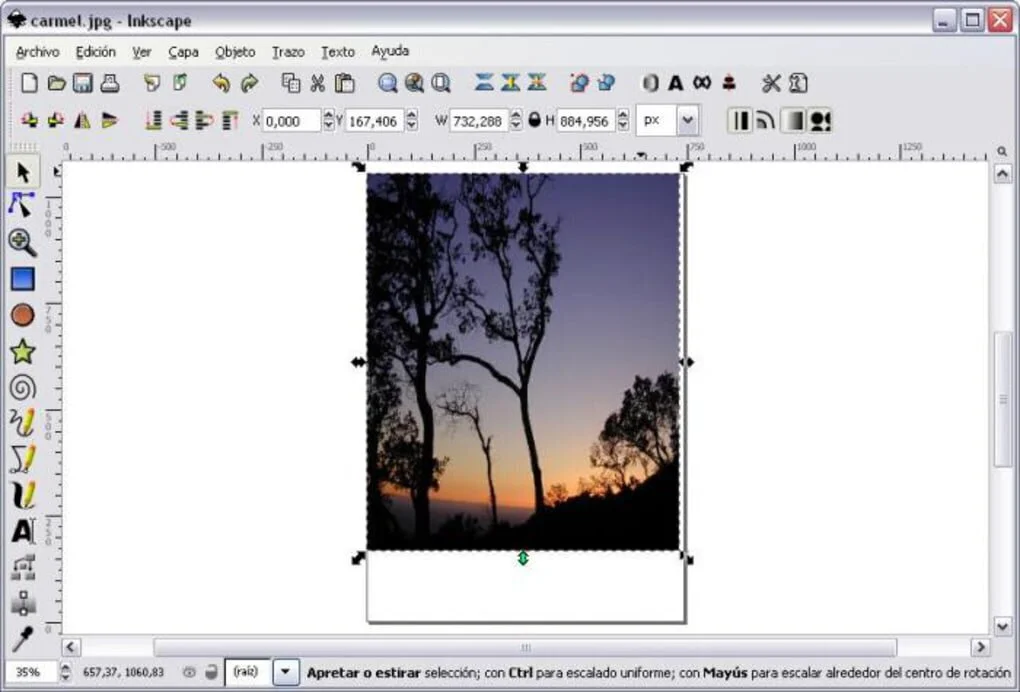
Inkscape can render crude vector and text. These items might be loaded up with intense colors or gradient shades. Integrations and optional features of plotting raster graphics are likewise present, empowering editors to make vector designs directly from photographs and other raster sources. Constructed shapes can be additionally controlled with movements, for example, moving, pivoting, scaling, and slanting.
Features
- Object Manipulation
- Vector Graphics Rendering
Pros
- Text Support
- Multiple Supported Formats
Cons
- Steep Learning Curve
Pricing
- Subscription: $14/month
Download: Inkscape for Windows | Mac | Linux
9. Lucidchart
Lucidchart is an online platform that provides services to collaborate on drawing, editing, and sharing graphs and diagrams. Lucidchart is available as both a paid or free version. It is an entirely cloud-based solution that runs on HTML5 and enables users to create organization charts, wireframes, UML, and flowchart drawing, among others.
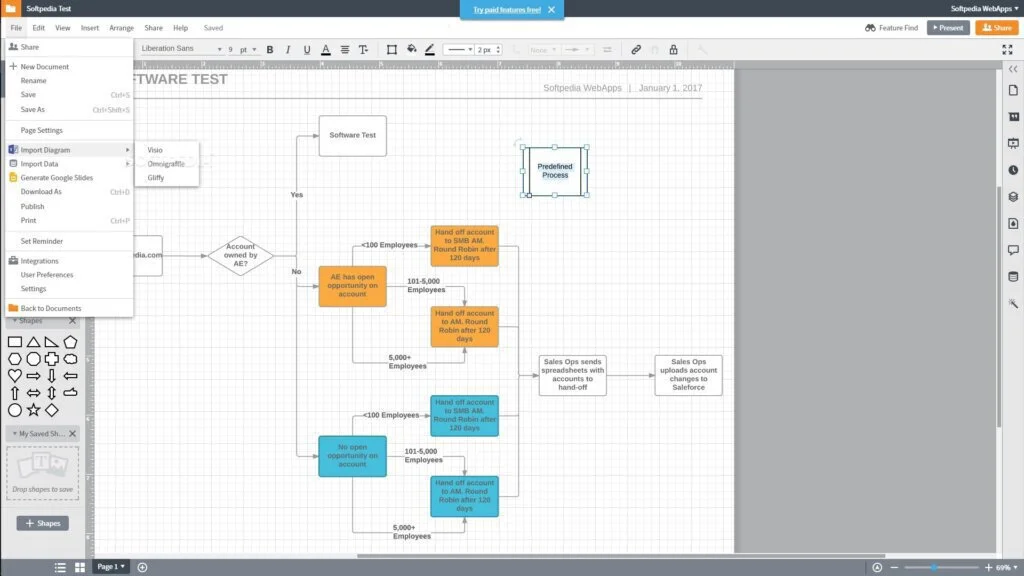
Lucidchart makes it simple to create proficient charts and artworks, ranging from framework structure to brainstorming and project management. It helps bolster the entirety of customer’s communications and collaboration needs. It is a visual work environment that combines designing, collaboration, and data perception to enhance understanding and accelerate advancement.
Features
- Variety of templates
- Freedom to draw any type of diagram
Pros
- The top-rated platform of 2020
- Remote collaboration
Cons
- Lack of customer support
Pricing
- Individual: $8/month/billed annually
- Team:: $20/month/billed annually
Visit: Lucidchart
10. MindNode
Mindnode is a platform for Mac and iOs that eases the process of brainstorming and allowing users to portray their ideas as pictures. Sort and add more context to ideas with Visual Labels. Organize thoughts and concentrate on a particular group of ideas that are, in any case, not directly associated.
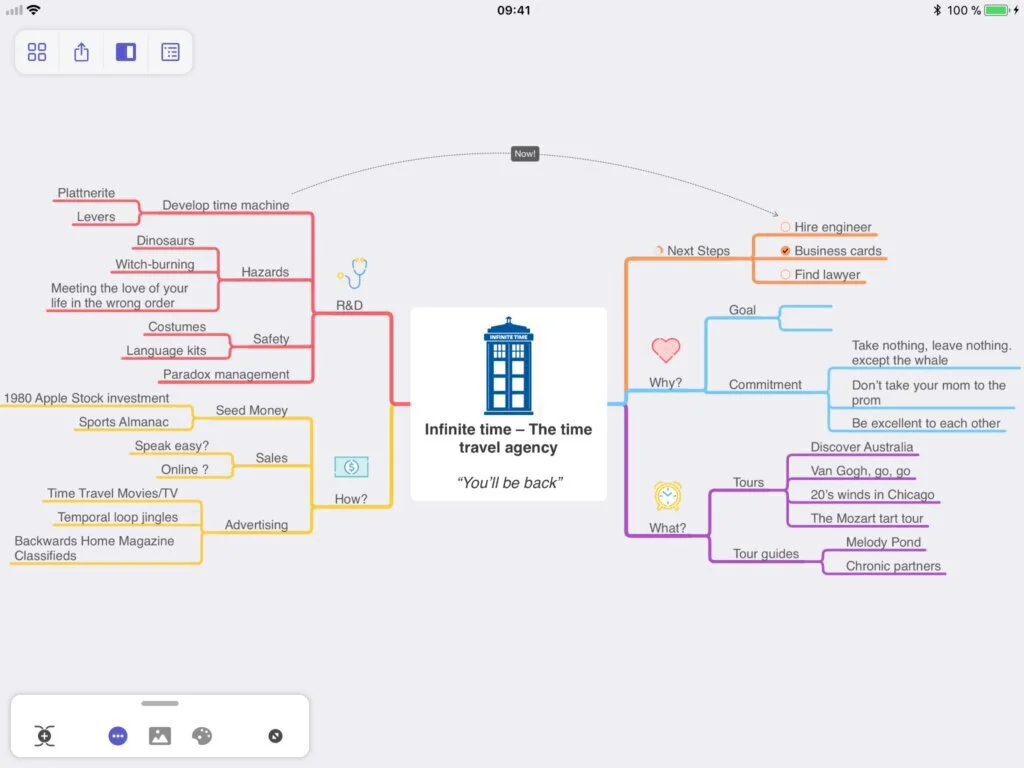
It allows users to keep remain updated with their tasks by changing nodes into assignments. Effectively adjusting user’s shopping list, research deadlines, or weekend plans with the Apple Reminder application and conveniently check off completed tasks.
Features
- Visual labels
- Focus Mode
Pros
- Progress Tracking
- Alerts and Reminders
Cons
- Only supports Apple products
Pricing
- Subscription: $2.59/month
Download: Mindnode for Mac
Final Thoughts
Even though professional creators may utilize these platforms, most of the users making charts and diagrams are not professional designers. Consequently, they need tools that require no training or expertise to use. However, still enabling to produce proficient looking designs quickly.
A user should choose the necessary platforms according to the pictorial requirements. For example, some tools are made explicitly for flowchart drawing, while others are used to create a network diagram and some for architecture designs. The optimal platform should suit the user’s operating system, design needs, and budget.


